Introduction
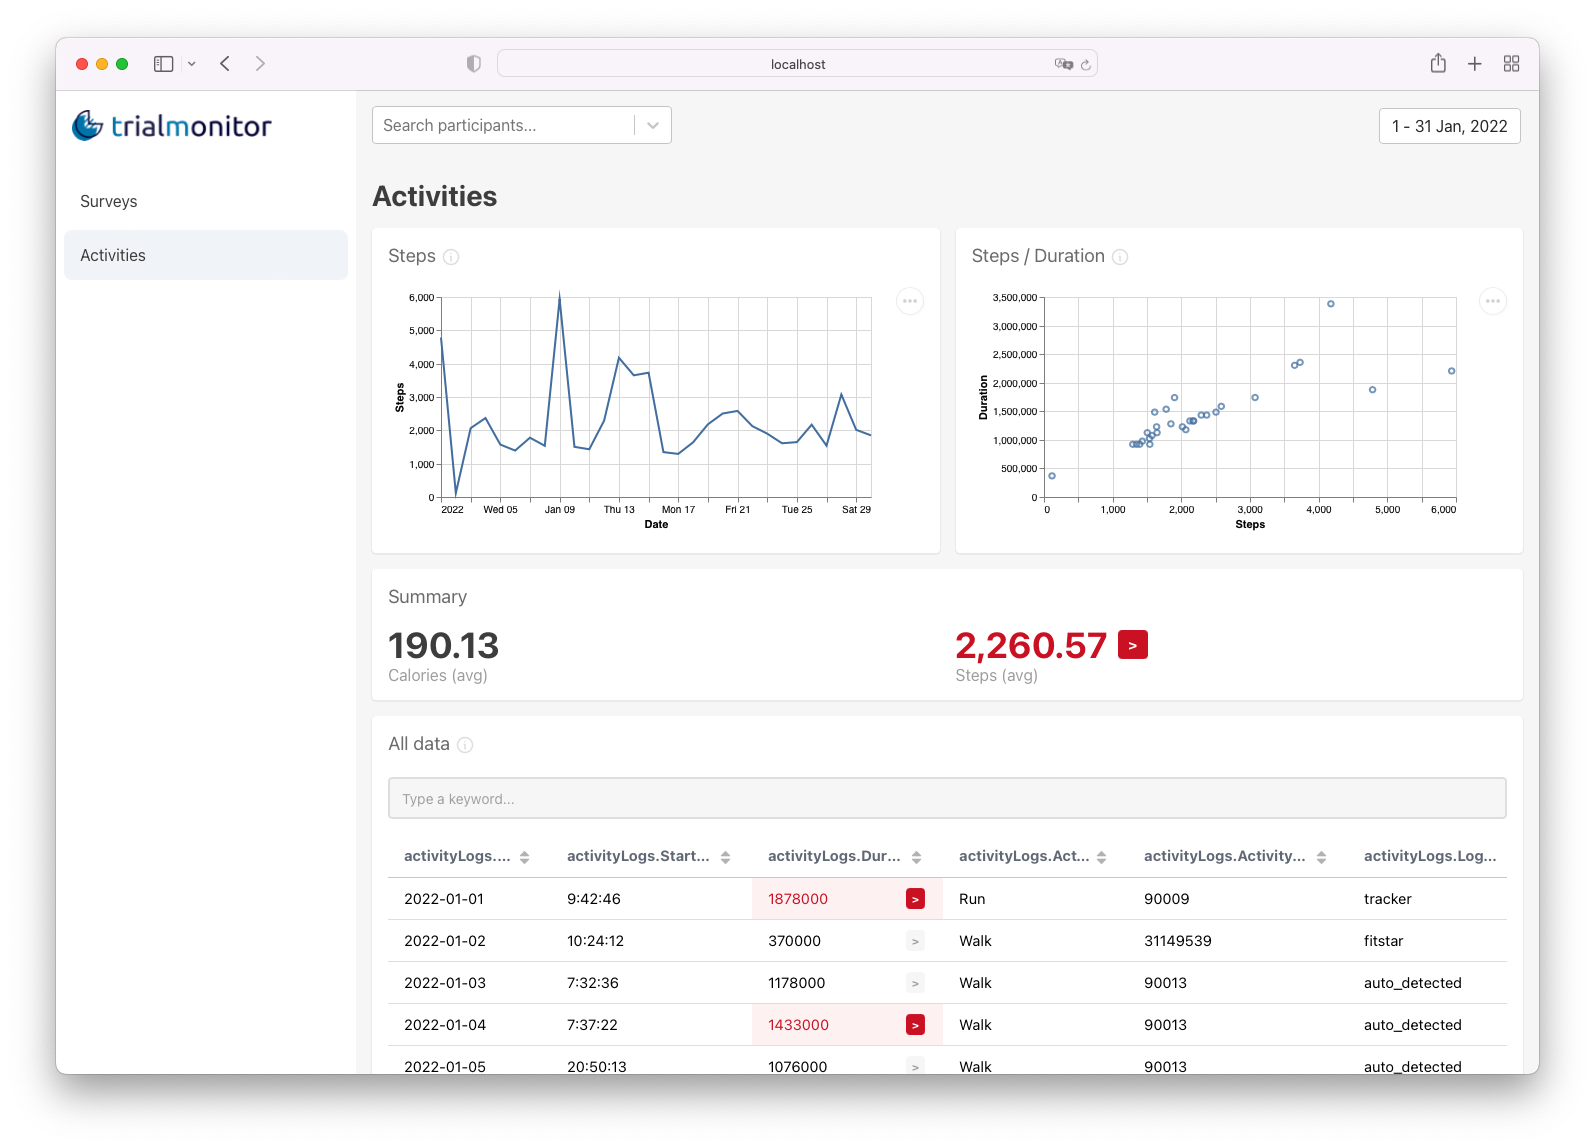
Trial Monitor is a tool that enables developers and researchers to create personalized web dashboards for monitoring participants in technology-enabled field trials. The tool was designed to reduce the work of developing one’s own dashboard, the need to adapt the technology stack to an existing dashboard, or the need to create a different dashboard tool for each project.
Trial Monitor uses simple configuration files to define the connection to different databases, the types of visualizations to be used, and the user interface that researchers will see to make sense of the user-generated data.
Requirements
Ensure that you have Node.js (tested with v16) or Docker installed on your machine according to your desired setup.
Getting Started
Trial Monitor can either be installed directly on your machine or used through Docker. In the repository, we provide a config with examples and sample data, as well as Docker files and Docker images for easy deployment.
You can use the published docker images to run Trial Monitor without cloning the repository. To do so, follow these instructions:
-
Download the config.template folder.
-
Unzip it and rename
config.templatetoconfig. -
Edit the files in the
configfolder according to the needs of your project. Don't forget to specify the location where the API will run inapi_urlwithin theui-config.jsonfile. -
Run the services using docker or docker-compose. Make sure you map the
configfolder as a volume as shown in the following example:
version: "3"
services:
  api:
    image: ghcr.io/fraunhoferportugal/trialmonitor-api:latest
    volumes:
      - ./config:/usr/config
    ports:
      - 3001:80
  frontend:
    image: ghcr.io/fraunhoferportugal/trialmonitor-ui:latest
    volumes:
      - ./config/ui-config.json:/usr/share/nginx/html/ui-config.json
    ports:
      - 80:80
For this example, the api_url within the ui-config.json file needs to be "http://host.docker.internal:3001/api" (verify if it is correctly configured, more information here) or "http://<domain_name>:3001/api".
Check here for a more complex example of a docker-compose file. Don't forget to replace build property from api and frontend services with the respective docker images.
Building from Source
To install Trial Monitor on your machine from the source repository follow the steps below:
- Clone the repository on your machine
git clone https://github.com/fraunhoferportugal/trial-monitor.git
-
Rename
config.templatetoconfig -
Edit the files in the
configfolder according to the needs of your project
Running Trial Monitor
To use Trial Monitor directly on your machine just install the dependencies and run the project with yarn:
yarn install
yarn run dev
Or you can use the docker-compose file:
# Production
docker-compose -f docker-compose.yaml up

# Development
docker-compose -f docker-compose.dev.yaml up
If you're running Trial Monitor in a VM set the API_URL with http://<ip>/api and set the Host rule on the services' labels (e.g., - "traefik.http.routers.frontend.rule=Host(<ip>) && PathPrefix(/)").
When running with docker in development, you shouldn't install the packages using yarn in your host. The startup script will install the packages for you. If you did, delete the directories: packages/client/node_modules and packages/server/node_modules.
In development mode, Trial Monitor API will run by default on port 3001, while the UI will run by default on port 8080. When running in development mode all changes in the config files will be automatically reflected on the interface.
To run Trial Monitor with authentication check the instructions here.