Intelligent Traffic Control Demo
This demonstrator showcases a traffic monitoring system on a Kubernetes cluster equipped with a device featuring a noise sensor and a camera. The captured video is transmitted to a web-based streaming application, making it easily accessible for real-time monitoring. Similarly to the Temperature Monitoring Demo, FITA enables a custom component to collect noise data and visualize it in Grafana dashboards. To enable traffic image processing, when the noise surpasses a predefined threshold, the system triggers an AI model that processes the collected images for object detection. In a real-world scenario, this approach increases the energy efficiency by limiting image processing to noisy situations while enabling real-time traffic monitoring.
High-level Overview
For demo purposes and since we are using an emulated environment, instead of using real images, we take advantage of a pre-recorded video that is sent to the emulated device. This is represented by the red arrow in the high-level overview.
Demo Components
FITA 
Enables the integration of Far-Edge devices equiped with noise sensors and cameras that transmit real-time data in a Kubernetes cluster. Explore more about FITA in the Docs page.
InfluxDB
A time series database deployed in the K8s cluster used to store the noise data collected by the devices. Furthermore, all cluster components can query the database to access to the most updated noise data.
Sensor Data Collector
The Sensor Data Collector is a custom component that collects new noise data published by the application running in the Far-Edge device, which is responsible for acquiring environmental measurements, and control the video component by enabling or disabling image processing. In order to access the noise data captured by the devices, the Sensor Data Collector must connect itself to the FITA MQTT Broker by subscribing the topic where real-time noise data will be available. In addition to storing the new noise data in the InfluxDB when new data is acquired, this component is responsible to analyse the data to enable or disable the image processing depending on the noise values. This is done by sending requests directly to the Video Component.
Video Component
The Video Component is the custom component capable of processing the video images using an pre-trained AI model for object detection. It provides a simple API so that external components, the Sensor Data Collector in particular, can enable or disable the image processing. Furthermore, this component feeds the go2rtc with the video images. For demo purposes and since we are using an emulated environment, instead of using real images, we take advantage of this component to sent a pre-recorded video to the emulated device.
go2rtc
go2rtc is an open-source real-time communication (RTC) server that acts as a universal bridge between different video and audio streaming protocols, and it enables low-latency live video streaming directly in browsers or apps without relying on heavy software. Its focus is on performance, flexibility, and minimal resource usage while providing modern streaming capabilities. This component is used to live stream the capture video, either processed or not by the Video Component.
Prometheus
Prometheus can be deployed in a Kubernetes cluster to obtain metrics from the Kubernetes components, pods, and services. It provides a powerful query language (PromQL) to monitor performance and integrate with visualization tools like Grafana, where we can present node and pod information, along with other metrics from our Kubernetes cluster.
Grafana
Grafana is responsible for enabling real-time monitoring and allowing data analysis through interactive dashboard, charts and panels. Grafana facilitates the connection to Prometheus allowing Kubernetes metrics visualization, and to InfluxDB, enabling real-time visualization of the captured noise data. Finally, the integration with a streaming server is enabled by Grafana, supporting video streaming using go2rtc.
Deployment
- Clone FITA Demos repository and go to demo root folder
# Clone repo
git clone https://github.com/fraunhoferportugal/fita.git

# Go to demo root folder
cd fita/demos/intelligent-traffic-control-demo
- Execute the demo deployment script
Check out the Deploy Demo: Step-by-Step section to fully comprehend how the deploy of the Intelligent Traffic Control Demo is achieved by following the provided step-by-step guide instead of running the following deployment script.
./scripts/deploy-demo.sh
- Deploy noise monitoring service to the emulated device
kubectl apply -f services/embserve/deployment.yaml
- Validate that all demo components are running correctly
kubectl get pods
Which should output:
NAME                                                     READY   STATUS    RESTARTS   AGE
fita-fita-b9696dd47-rpdms                                4/4     Running   0          87s
far-edge-kubelet-labnuc05-b1-node1                       1/1     Running   0          56s
fita-metrics-kube-promethe-operator-65c5d54c45-k5fcf     1/1     Running   0          78s
fita-metrics-kube-state-metrics-59579cf8f4-lzd7c         1/1     Running   0          78s
fita-metrics-prometheus-node-exporter-sq2xz              1/1     Running   0          78s
fita-tig-grafana-85fdbc74d7-t46br                        1/1     Running   0          85s
fita-tig-influxdb2-0                                     1/1     Running   0          85s
fita-tig-telegraf-5544c55dcf-njtv6                       1/1     Running   0          85s
intel-gpu-plugin-smqnc                                   1/1     Running   0          4d15h
noise-deployment-64fc468bc9-zcmt4                        1/1     Running   0          12s
prometheus-fita-metrics-kube-promethe-prometheus-0       2/2     Running   0          77s
sensor-consumer-noise-sensor-consumer-679dc55875-xlflt   1/1     Running   0          63s
video-component-video-component-64fdb69b9b-l2lsn         2/2     Running   0          64s
FITA containers: NextgenGW, Far-Edge Node Watcher, MQTT Broker, and Far-Edge Connection Provisioner
Video Component containers: Video component and go2rtc
- Uninstall Intelligent Traffic Control Demo
./scripts/uninstall-demo.sh
Deploy Demo: Step-by-Step
Instead of performing the Deployment step by executing the deployment script, you can follow this step-by-step guide to achieve and comprehend the process of deploying the Temperature Monitoring Demo.
- FITA deployment
- You can also follow the Installing FITA guide
helm install fita oci://ghcr.io/fraunhoferportugal/fita --version 0.1.0
- Telegraf, InfluxDB and Grafana deployment
helm install fita-tig oci://ghcr.io/fraunhoferportugal/fita/demos/common/charts/tig
kubectl apply -f ./services/grafana/service.yaml
- Prometheus stack deployment
helm repo add prometheus-community https://prometheus-community.github.io/helm-charts
helm repo update
helm install fita-metrics prometheus-community/kube-prometheus-stack --set grafana.enabled=false
- Enable Intel plugin to use GPU in kubernetes
Note that ./scripts/intel/deploy-intel-gpu-plugin.sh script depends on microk8s installed from snap. You may adapt the script accordingly to the desired K8s distributions
GIT_EXEC_PATH=/snap/microk8s/current/usr/lib/git-core microk8s kubectl apply -k 'https://github.com/intel/intel-device-plugins-for-kubernetes/deployments/nfd?ref=main'
GIT_EXEC_PATH=/snap/microk8s/current/usr/lib/git-core microk8s kubectl apply -k 'https://github.com/intel/intel-device-plugins-for-kubernetes/deployments/nfd/overlays/node-feature-rules?ref=main'
GIT_EXEC_PATH=/snap/microk8s/current/usr/lib/git-core microk8s kubectl apply -k 'https://github.com/intel/intel-device-plugins-for-kubernetes/deployments/gpu_plugin/overlays/nfd_labeled_nodes?ref=main'
- Sensor Data Collector deployment
microk8s helm install sensor-consumer oci://ghcr.io/fraunhoferportugal/fita/demos/intelligent-traffic-control/charts/noise-sensor-consumer --version 0.1.0
- Video Component deployment
microk8s helm install video-component oci://ghcr.io/fraunhoferportugal/fita/demos/intelligent-traffic-control/charts/video-component --version 0.1.0
- Adding Far-Edge Nodes
Do not forget to replace <IP ADDRESS> by the address of the node running FITA
docker container run --name embserve_nodes \
  --privileged \
  --network host \
  -v /dev/pts/:/dev/pts/ \
  -v ./services/embserve/noise_service/workspace:/workspace \
  -d ghcr.io/fraunhoferportugal/fita/components/iotnetemu:0.1.0 "--workspace /workspace"

# wait for the initialization of all services
sleep 5

docker exec -d embserve_nodes socat UDP4-LISTEN:5683,fork,so-bindtodevice=lnxbr-0,reuseaddr UDP4:<IP ADDRESS>:30009
- Grafana dashboard setup
Do not forget to replace <IP ADDRESS> by the address of the node running FITA
# Update IP address of grafana
GRAFANA_FRAME_LINE='\t\t\t\t\t"content": "<p style=\\\"text-align: center\\\"> <iframe width=\\\"889\\\" height=\\\"500\\\" src=http://'<IP ADDRESS>':30100/stream.html?src=mystream> </iframe> </p>",'
sed "143c \ $GRAFANA_FRAME_LINE" -i dashboard.json

./services/grafana/import.sh -l http://localhost:30101 -u admin \
    -p $(kubectl get secret fita-tig-grafana -o jsonpath="{.data.admin-password}" | base64 --decode ; echo) \
    -t $(kubectl get secret fita-tig-influxdb2-auth -o jsonpath="{.data.admin-token}" | base64 --decode ; echo)
- Temperature monitoring service deployment
kubectl apply -f ./services/embserve/deployment.yaml
Intelligent Traffic Control
This demo provides two main interactive components:
Device Video Stream
The video stream is accessible at http://<IP_ADDRESS>:30100/stream.html?src=mystream, where the <IP_ADDRESS> is the address of the host machine.
Intelligent Traffic Control Dashboard
The grafana dashboard is accessible at http://<IP_ADDRESS>:30101, where the <IP_ADDRESS> is the address of the host machine, and using the following credentials:
- username:
admin - password: can be obtained by executing:
kubectl get secret fita-tig-grafana -o jsonpath="{.data.admin-password}" | base64 --decode ; echo
If you have executed the deployment script successfully, the Grafana dashboard URL, username and password were shown in the console.
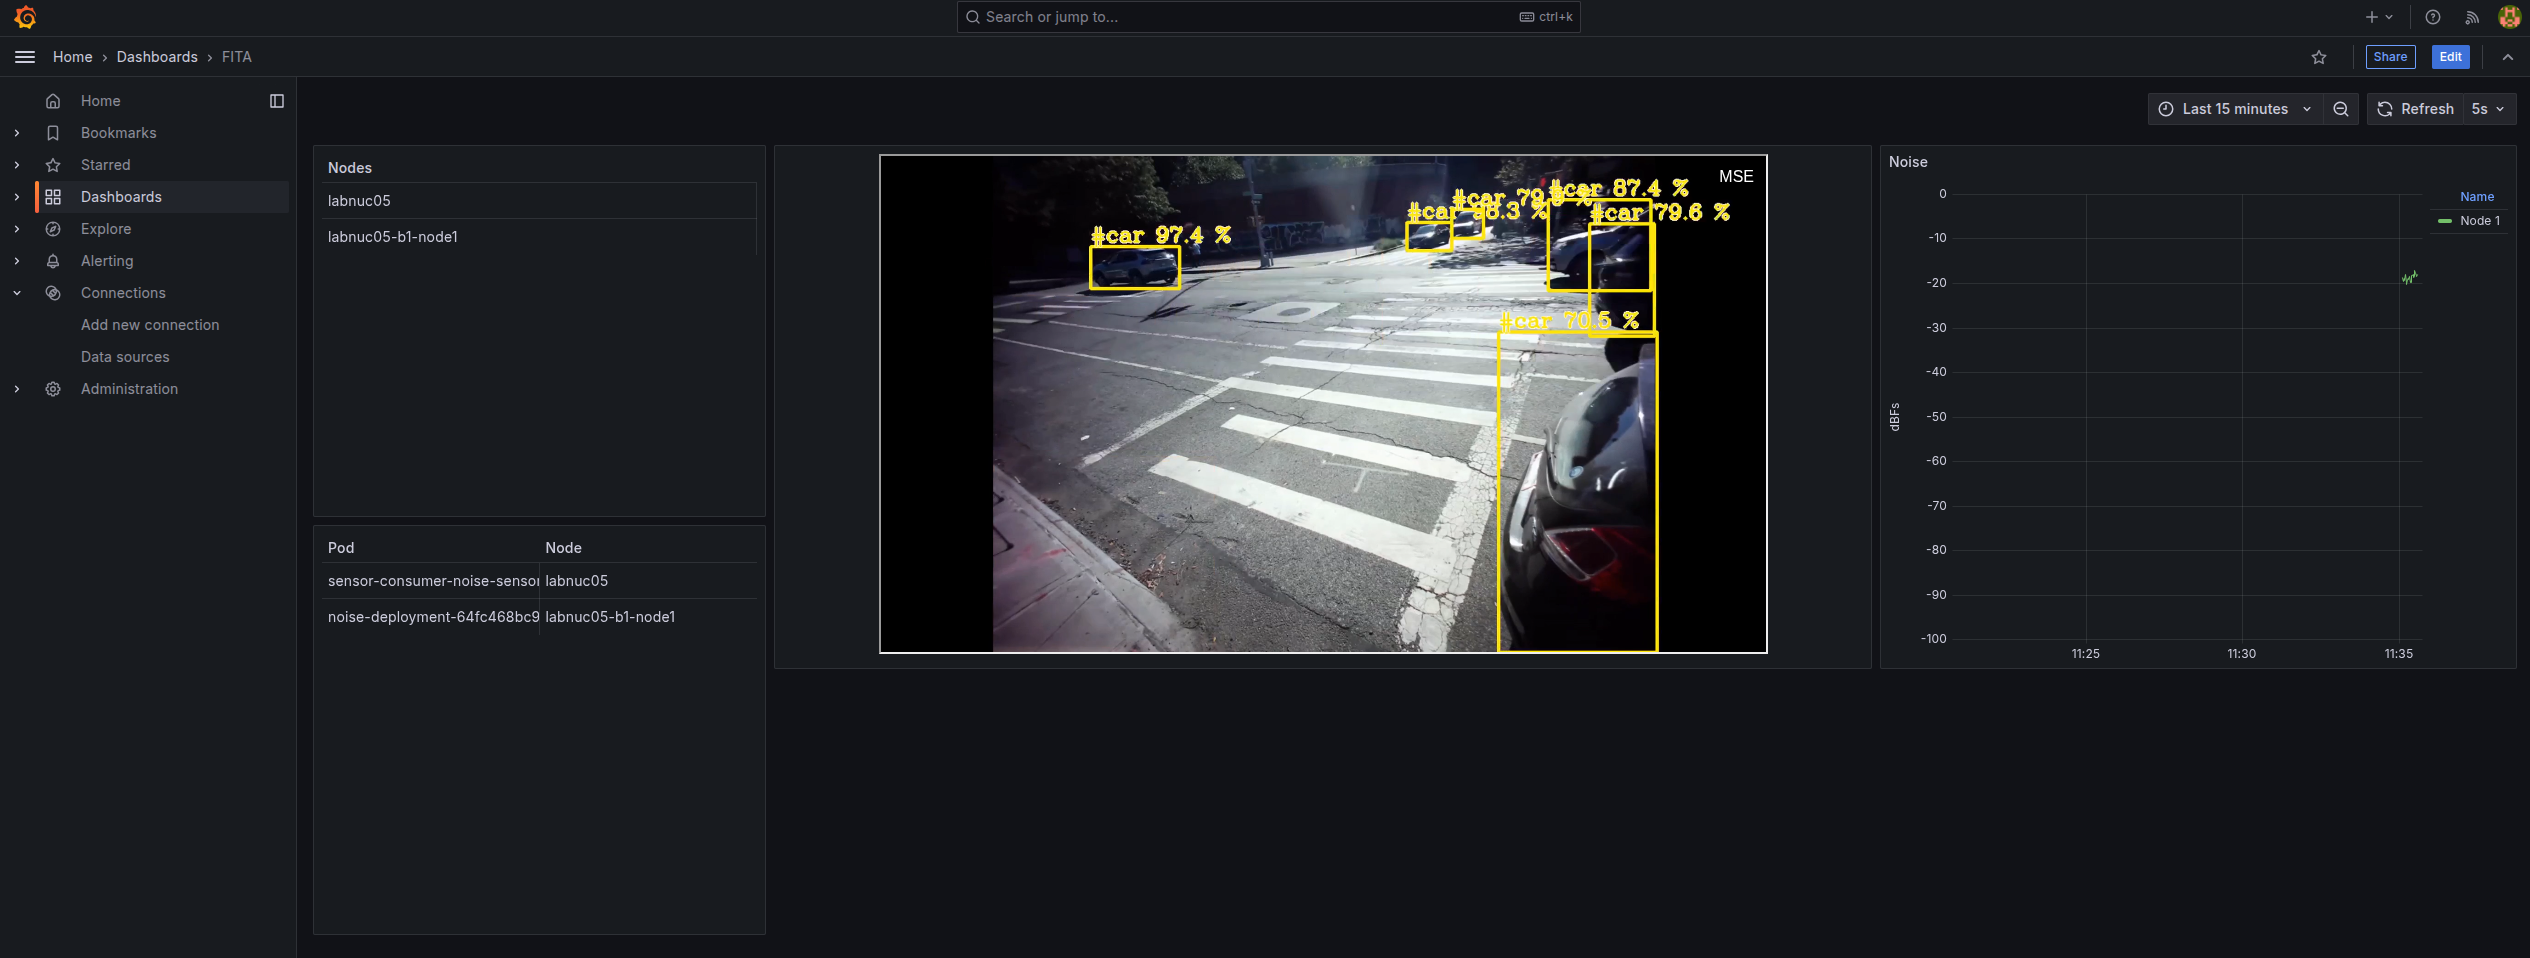
The Intelligent Traffic Control Dashboard, illustrated in the image below, provides the following information:
- Nodes panel: shows the available nodes in the Kubernetes cluster
- Pod/Node panel: presents the name of noise pods associated with the responsible node where it is running
- Noise: graph providing the real-time noise data acquired by the devices
- Video: traffic video stream