Temperature Monitoring Demo
This demonstrator showcases FITA by presenting a temperature monitoring system built on top of a Kubernetes cluster and using two (emulated) Far-Edge nodes to acquire environment measurements. A custom component is deployed across the cluster to collect temperature data from the Far-Edge nodes. FITA is the core component of this demonstrator as it is responsible of enabling the management of Far-Edge devices and allowing the data collection. The goal of this demo is the simulation of a real-world monitoring scenario that collects environment metrics.
High-level Overview
Demo Components
FITA 
Enables the integration of Far-Edge devices equiped with temperature sensors that transmit real-time data in a Kubernetes cluster. Explore more about FITA in the Docs page.
InfluxDB
A time series database deployed in the K8s cluster used to store the temperature data collected by the devices. Furthermore, all cluster components can query the database to access to the most updated temperature data.
Sensor Data Collector
The Sensor Data Collector is a custom component responsible for collecting new temperature data published by the application running in the Far-Edge devices, which acquire environmental measurements. In order to access the temperature data captured by the devices, the Sensor Data Collector must connect itself to the FITA MQTT Broker by subscribing the topic where real-time temperature data will be available. Finally, when new temperature data is acquired, this component stores it in the InfluxDB.
Prometheus
Prometheus can be deployed in a Kubernetes cluster to obtain metrics from the Kubernetes components, pods, and services. It provides a powerful query language (PromQL) to monitor performance and integrate with visualization tools like Grafana, where we can present node and pod information, along with other metrics from our Kubernetes cluster.
Grafana
Grafana is responsible for enabling real-time monitoring and allowing data analysis through interactive dashboard, charts and panels. Grafana facilitates the connection to Prometheus allowing Kubernetes metrics visualization, and to InfluxDB, enabling real-time visualization of the captured temperature data.
Deployment
- Clone FITA Demos repository and go to demo root folder
# Clone repo
git clone https://github.com/fraunhoferportugal/fita.git

# Go to demo root folder
cd fita/demos/temperature-monitoring-demo
- Execute the demo deployment script
Check out the Deploy Demo: Step-by-Step section to fully comprehend how the deploy of the Temperature Monitoring Demo is achieved by following the provided step-by-step guide instead of running the following deployment script.
./scripts/deploy-demo.sh
- Deploy temperature monitoring service to emulated devices
kubectl apply -f embserve/deployment.yaml
- Validate that all demo components are running correctly
kubectl get pods
Which should output:
NAME                                                              READY   STATUS    RESTARTS   AGE
far-edge-kubelet-labnuc05-b1-node1                                1/1     Running   0          2m35s
far-edge-kubelet-labnuc05-b1-node2                                1/1     Running   0          2m35s
fita-fita-695cd9b859-4jnlm                                        3/3     Running   0          2m58s
fita-metrics-kube-promethe-operator-6d47988b89-xj285              1/1     Running   0          2m47s
fita-metrics-kube-state-metrics-59579cf8f4-2cdnj                  1/1     Running   0          2m47s
fita-metrics-prometheus-node-exporter-gnrjh                       1/1     Running   0          2m47s
fita-tig-grafana-77999c5769-mcrlm                                 1/1     Running   0          2m56s
fita-tig-influxdb2-0                                              1/1     Running   0          2m56s
fita-tig-telegraf-5544c55dcf-wxdg9                                1/1     Running   0          2m56s
prometheus-fita-metrics-kube-promethe-prometheus-0                2/2     Running   0          2m46s
sensor-data-collector-simple-sensor-data-collector-7fbf65dhb2lm   1/1     Running   0          2m54s
temperature-deployment-64ddd79478-5l7p5                           1/1     Running   0          2m22s
temperature-deployment-64ddd79478-q2b95                           1/1     Running   0          2m22s
This demo uses an older version of FITA. Therefore, the only deployed containers within FITA are NextgenGW, Far-Edge Node Watcher, and MQTT Broker.
- Uninstall Temperature Monitoring Demo
./scripts/uninstall-demo.sh
Deploy Demo: Step-by-Step
Instead of performing the Deployment step by executing the deployment script, you can follow this step-by-step guide to achieve and comprehend the process of deploying the Temperature Monitoring Demo.
- FITA deployment
- You can also follow the Installing FITA guide
helm install fita oci://ghcr.io/fraunhoferportugal/fita --version 0.1.0
- Telegraf, InfluxDB and Grafana deployment
helm install fita-tig oci://ghcr.io/fraunhoferportugal/fita/demos/common/charts/tig
kubectl apply -f ./services/grafana/service.yaml
- Prometheus stack deployment
helm repo add prometheus-community https://prometheus-community.github.io/helm-charts
helm repo update
helm install fita-metrics prometheus-community/kube-prometheus-stack --set grafana.enabled=false
- Sensor Data Collector deployment
helm install sensor-data-collector oci://ghcr.io/fraunhoferportugal/fita/demos/temperature-monitoring/charts/simple-sensor-data-collector
- Adding Far-Edge Nodes
Do not forget to replace <IP ADDRESS> by the address of the node running FITA
docker container run --name embserve_nodes \
  --privileged \
  --network host \
  -v /dev/pts/:/dev/pts/ \
  -v ./services/embserve/temperature_sensor/workspace:/workspace \
  -d ghcr.io/fraunhoferportugal/fita/components/iotnetemu:0.1.0 "--workspace /workspace"

# wait for the initialization of all services
sleep 5

docker exec -d embserve_nodes socat UDP4-LISTEN:5683,fork,so-bindtodevice=lnxbr-0,reuseaddr UDP4:<IP ADDRESS>:30009
- Grafana dashboard setup
./services/grafana/import.sh -l http://localhost:30101 -u admin \
    -p $(kubectl get secret fita-tig-grafana -o jsonpath="{.data.admin-password}" | base64 --decode ; echo) \
    -t $(kubectl get secret fita-tig-influxdb2-auth -o jsonpath="{.data.admin-token}" | base64 --decode ; echo)
- Temperature monitoring service deployment
kubectl apply -f ./services/embserve/deployment.yaml
Temperature Monitoring Dashboard
The grafana dashboard is accessible at http://<IP_ADDRESS>:30101, where the <IP_ADDRESS> is the address of the host machine, and using the following credentials:
- username:
admin - password: can be obtained by executing:
kubectl get secret fita-tig-grafana -o jsonpath="{.data.admin-password}" | base64 --decode ; echo
If you have executed the deployment script successfully, the Grafana dashboard URL, username and password were shown in the console.
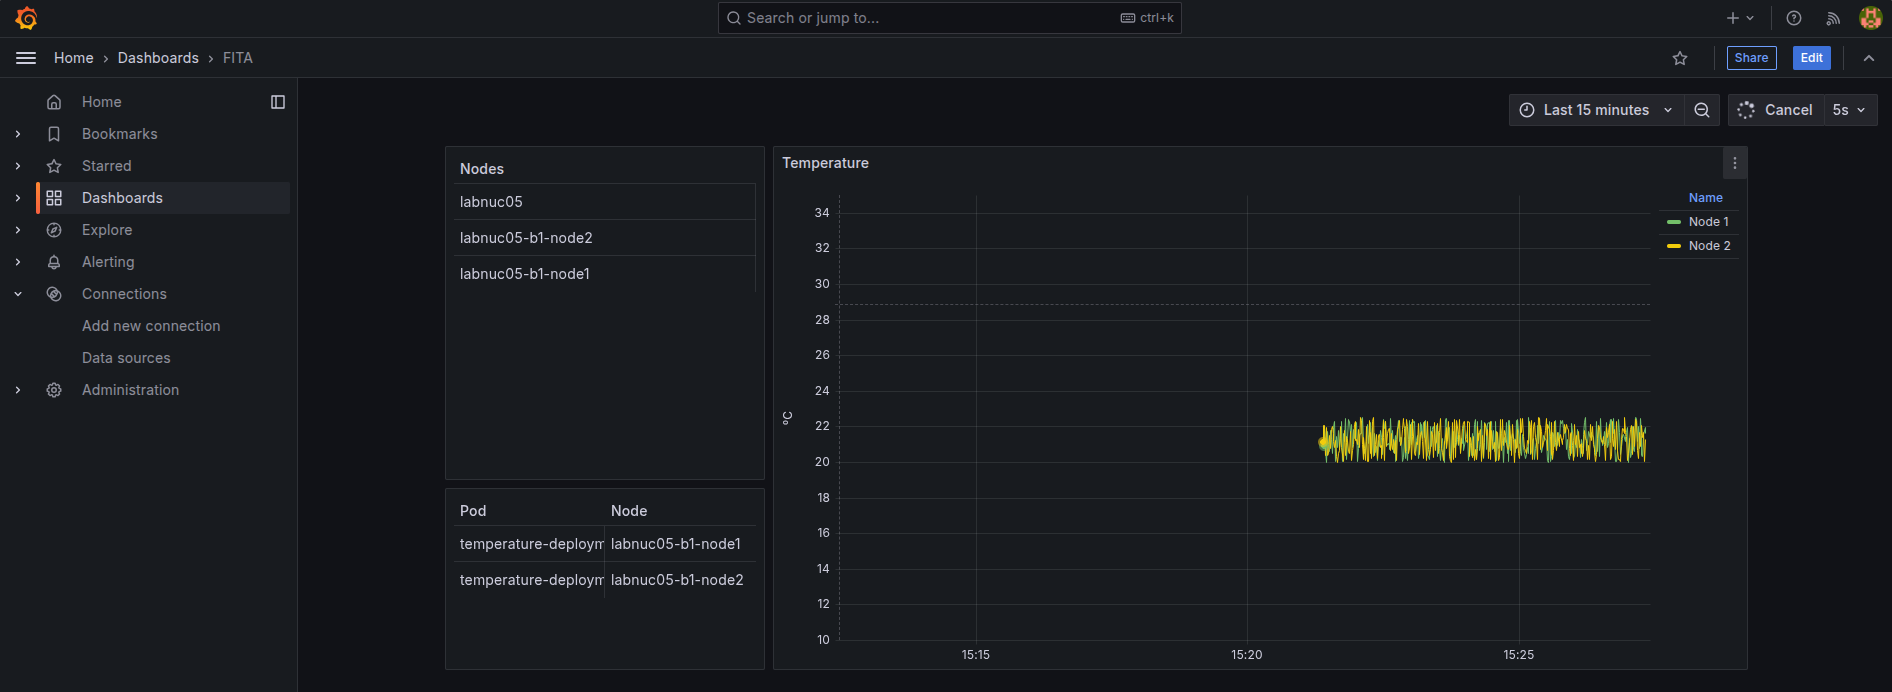
Grafana Dashboard
The Temperature Monitoring Dashboard, illustrated in the image below, provides the following information:
- Nodes panel: shows the available nodes in the Kubernetes cluster
- Pod/Node panel: presents the name of temperature pods associated with the responsible node where it is running
- Temperature: graph providing the real-time temperature data acquired by the devices